
Compressing a Causal Chain: What Has to Be True
Compressing a Causal Chain: What Has to Be True
Kepler could have added one more circle, which is what most investment memos do.
I have increasingly come to think that a good investment thesis is a causal model of what has to be true for a company to reach one of a small number of valuable future states. A new capability makes something possible. That creates an advantage for a customer. The advantage is large enough to change behaviour. Adoption creates scale, and scale produces some combination of distribution, data, learning, brand, lower costs or switching costs. Those effects produce revenues and eventually enterprise value.
Or they do not.
Each arrow is an assumption, and a company can fail at any of them. It can have extraordinary technology and no meaningful customer advantage. It can hold a real advantage and fail to distribute it. It can win millions of enthusiastic users and never reach the enterprise buyers where most of the money was supposed to come from. Your prosumer wedge, which looked like a brilliant bottom-up route to market, can stay a prosumer business.
Beliefs and habits work the same way. Sometimes the causal chain holds because the world moves towards it. Remote work makes asynchronous software normal, a new generation becomes comfortable paying for something the previous one expected for free, a regulatory shock changes what buyers consider acceptable, and a technology moves from strange to obvious within three years.
And sometimes the zeitgeist moves the other way. Behaviour that looked structurally changed snaps back. Whole categories become culturally unattractive. Buyers decide that a previously desirable convenience is invasive, unsafe or simply no longer fashionable. What appeared to be product-market fit was partly product-moment fit, which belongs inside the model as an arrow and deserves a line of its own.
That is why I find the question what has to be true? more useful than what do we think will happen? The first forces the thesis apart. The second invites a story.
When the story starts repairing itself
Danger arrives when reality fails to fit the model. Retention is weak because the first cohort was atypical. Acquisition costs are up because we hired sales ahead of revenue. Enterprises are slow to sign because procurement has tightened.
Each of those may well be true. That is the problem. They arrive one at a time, months apart, each in its own meeting, each perfectly defensible on the day. Nobody is ever asked to defend the set. So a thesis that started out needing three things to be true is quietly needing seven, it still fits every number on the page, and no spreadsheet anywhere has a line for that.
Astronomers had exactly this problem for fifteen centuries. Ptolemy put each planet on a circle around the earth. When a planet refused to show up where its circle said it should, there was a standard repair.
Add another circle.
You gave the planet a second, smaller circle to ride on while the big one turned, and the gap closed. It worked every time, it could be done again whenever a new gap opened, and the system stayed accurate enough to navigate by for more than a thousand years. Each repair bought a better fit. Each repair also added a moving part, and nobody was keeping that second tally.
Then, around 1600, Johannes Kepler sat down with Tycho Brahe’s observations of Mars. His circle missed by eight arcminutes. An arcminute is a sixtieth of a degree, so eight of them come to about a quarter of the width of the full moon as you see it from a garden. Tycho’s instruments were sharp enough that the gap could not be blamed on the measuring.1 Kepler did the expensive thing. He threw out the circle and drew an ellipse.
A model can survive evidence against it by growing more complicated, and the extra weight rarely feels like a cost as we add it. Information theory gives a surprisingly precise way to charge for it.
What does it mean for an explanation to be simple?
Occam’s razor is usually boiled down to preferring the simpler account. I used to find that slightly unsatisfying. The world is complicated, so why should the simple one be right? The interesting answer, I think, is that being simple was never the point. What matters is what a short account buys you, and that answer arrived from a problem about telephone lines.
Claude Shannon started from a different problem, which was communication. His theory showed that an observation carries information exactly to the degree that it removes uncertainty, so something you could already have predicted tells you almost nothing when it finally arrives, and something you did not expect tells you a great deal.2 That creates a direct relationship between prediction and compression. Take:
ABABABABABABABAB
Once you see the regularity, the whole sequence becomes AB eight times. What can be predicted can usually be compressed, and what can be compressed holds some regularity that a model has caught. You transmit less because you have found something that lets you predict the missing bits.
Andrey Kolmogorov pushed the idea further. One way of thinking about it is that the complexity of an object is the length of the shortest program that can generate it. One thousand digits produced by a small repeating rule are not very complex in this sense, while one thousand genuinely irregular digits may have no description much shorter than writing all thousand down. That gives a beautiful way to think about theory. A good model makes the record smaller. A table giving where every planet sat on every night describes what was seen, and a compact set of laws that can generate where each planet sat has found structure.
I had already touched on this in an earlier note on life as computation. There I described a genome as, in one useful sense, a compressed model of the world in which its lineage has had to survive. It does not contain a map of the world. It holds enough of what stays true about the world to build an organism that behaves properly in it.
But there is a cheat, and it is why the shortest-program idea does not work fully on its own. Suppose my model is a program that carries the entire table of observations inside it and prints the table back. It reproduces the data perfectly, which is what we said we wanted. It is also exactly as long as the data, and it will tell me nothing whatsoever about tomorrow. Perfect fit turns out to be free as soon as you are allowed to make the model as big as the record.
So you have to charge for the model too. Jorma Rissanen did that in 1978. His Minimum Description Length principle, in a deliberately simplified form, asks you to minimise the cost of the model plus the cost of everything the model failed to see coming:
L(M) + L(D|M)
You want the sum to be small, which means a model that is short in itself and also leaves little unexplained.3 Something too crude to say much keeps a tiny first term and leaves almost everything to spell out. Something elaborate enough to fit every past observation pays for that fit by becoming enormous.
Our own moment errs hard in the first direction. We have learned to prize the short model and stopped asking what it fails to cover, so the one-line thesis, the single north-star metric and the dashboard that fits on a phone all win arguments on the strength of L(M) alone. The second term is still being paid, quietly, by whoever has to live with what the model did not see. I find that a genuinely sad way to run things, and it is the failure the word simplistic was invented for.
Take five points sitting roughly on a straight line. Writing y = 2x costs almost nothing and leaves a few small errors behind. Give me a polynomial with enough terms and I can thread all five exactly, so the second term drops to zero. To get there I had to fix five coefficients, and the only place I could read them off was those same five points. The model swallowed the data. I moved the cost from one column to the other and paid it either way.
Ray Solomonoff made the same point with a sequence. Suppose you see:
2, 4, 6, 8, 10
Infinitely many rules fit those five numbers. One says add two forever. Another says add two until ten, then output 847. Another carries a table of a million arbitrary values for what comes next. All three fit the record perfectly and all three disagree about the sixth number.4 Nothing in the data chooses between them, and what does the choosing is how much you have to write down to state each one.
That gives a much more interesting version of Occam. The best explanation is the one that accounts for the most without demanding either a complicated model or a long list of things left to explain away. An investment case works the same way. Explain one odd cohort by channel mix, the next by pricing, the next by seasonality, and the fit to the record improves every time while the thesis quietly turns into a high-degree polynomial. Nobody ever invoices you for the extra terms. That is most of why it happens. Commit to something that can fail and you will occasionally fail out loud, in front of people with long memories. Keep a thesis elastic enough to absorb anything and you will never have a bad day.
From explaining the past to constraining the future
A model deserves no credit merely for accommodating what already happened, because a theory able to explain every possible outcome explains very little when one particular outcome turns up. Which is why a good investment thesis has to do more than make the past coherent. It should constrain the future, so that if the model is right some paths become more likely and others less likely. That is much closer to how I want to think about venture. A line saying the company reaches 100m in 2031 gives me nothing to act on. I want a paragraph saying this:
If this capability really creates this economic advantage, and if that advantage survives the move from individual users to enterprise buyers, then several high-value paths become plausible. If the enterprise transition does not begin to appear by a certain point, an important branch of the thesis has failed.
The precision sits in the causal links, and never in pretending to know the exact end state. Every date in that second version is a place where reality gets to answer back.
Prediction is not yet explanation
There is still something missing. A model can compress what it has seen extremely well and predict what comes next while getting the causal structure wrong. We put money into companies specifically so that they can change things, which is a different question from watching what they do.
Judea Pearl’s The Book of Why sorts these into three rungs.5
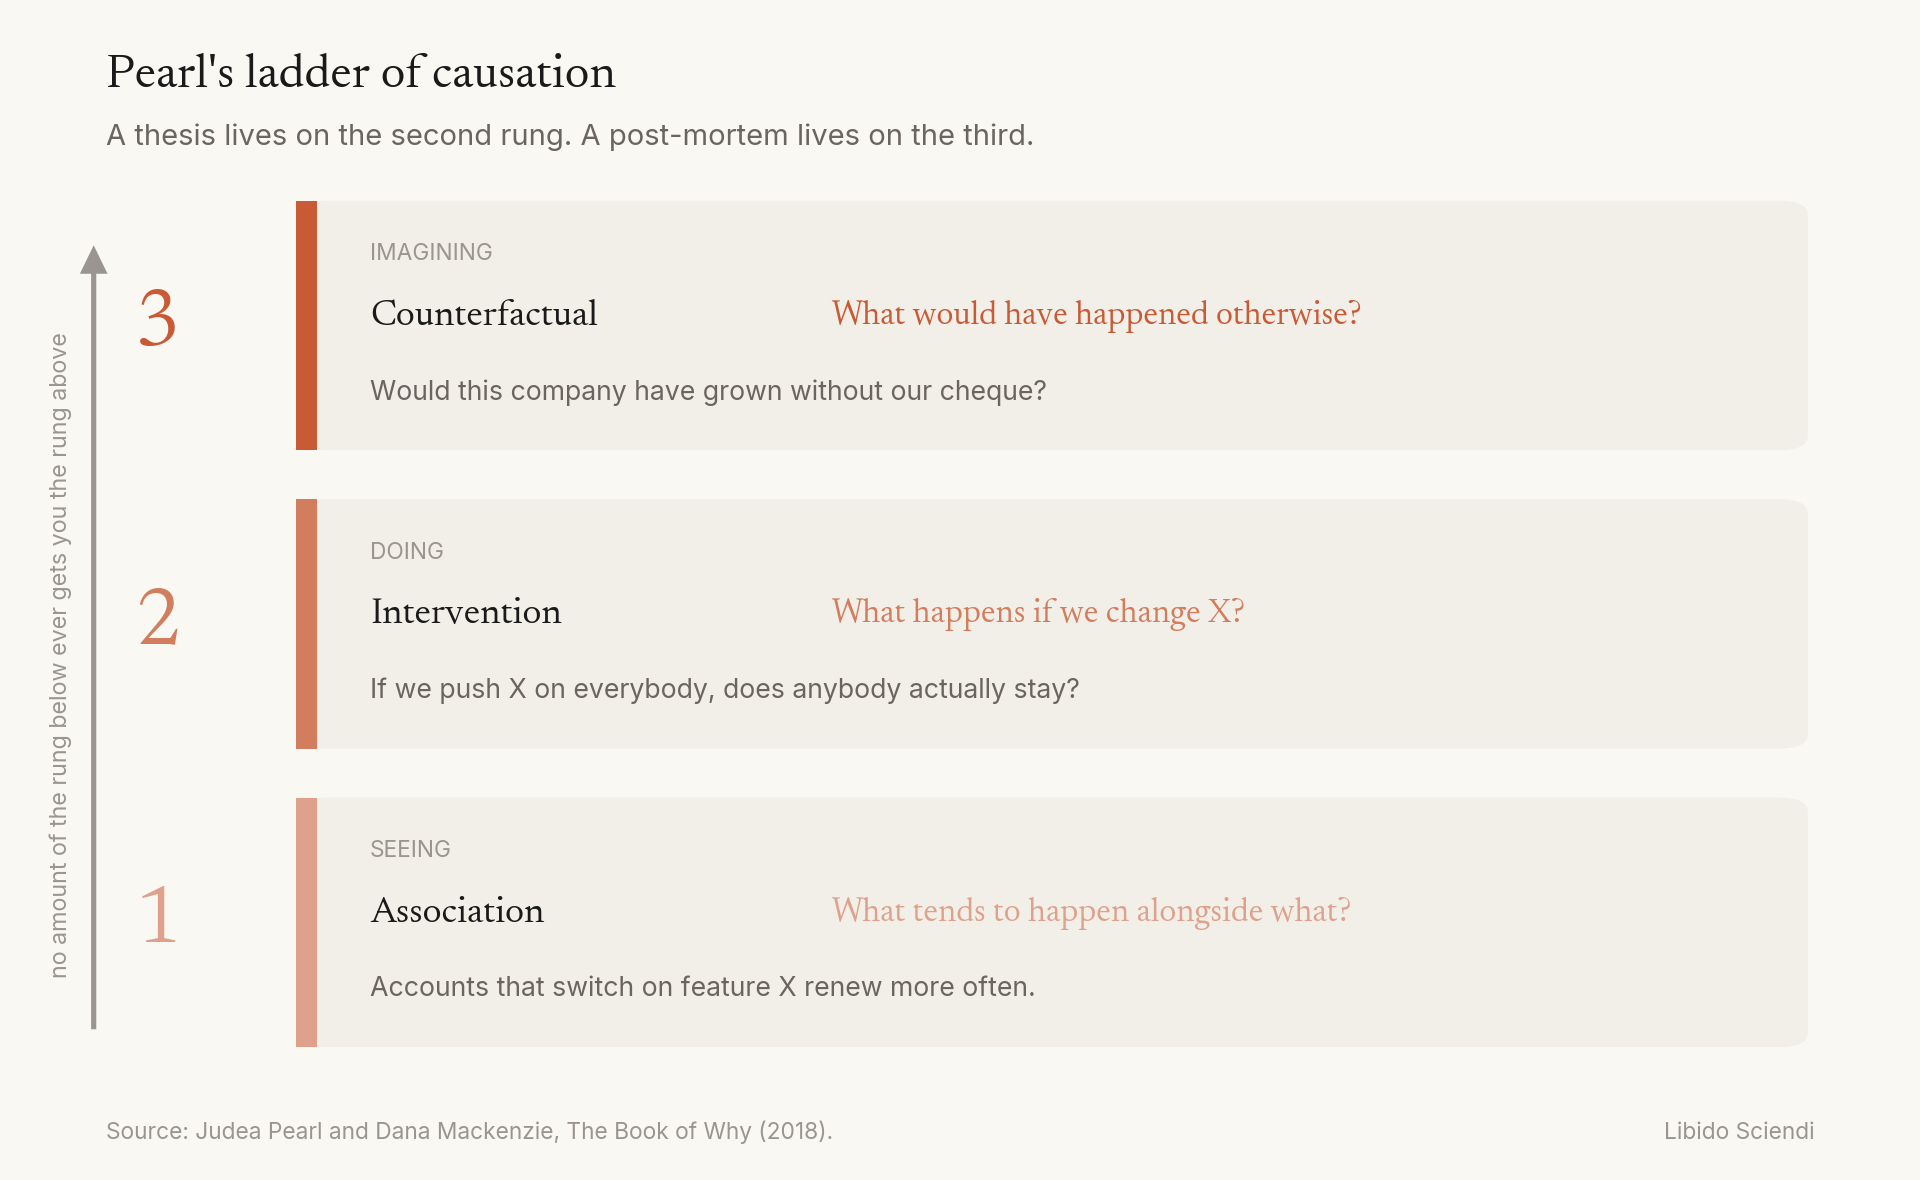
Writing a cheque is an act on the second rung. Judging afterwards whether the cheque made any difference is an act on the third, which is why post-mortems are so much harder than they look. You are asking what the company would have done without you, and that version is the one nobody ever gets to see.
A correlation can describe a path that does not actually exist. You can know that users who adopt feature X retain better without knowing whether pushing X on everybody makes anybody stay, since strong users may simply do both. You can know that companies selling to enterprises have higher revenue without knowing whether pushing a prosumer product upmarket builds an enterprise business, since the buyers, what the product must do, the sales cycle and the team around it may all change on the way.
So compression on its own is not enough. A useful investment thesis needs a causal chain, where something makes something else happen for a reason, and each arrow is a separate bet that can be graded on its own evidence. Written out, a chain in our portfolio looks like this:
Raidium. Foundation models → clinical tools → an orchestrated report → radiologist productivity → hospital ROI → routine adoption → wider workflow coverage → healthcare capacity.
Living Models. Genomic data → a DNA foundation model → better trait discovery → faster breeding R&D → better varieties → breeder ROI → adoption → traits deployed at scale.
EPICS. Plant-based production → new molecules → field efficacy → farmer ROI → adoption → hectares → changes in chemical use, yield or resilience.
Generare. Microbial biodiversity → cluster selection and expression → novel compounds → lower cost per useful discovery → hits and leads → deals.
Written out, a chain shows you where the evidence actually sits. The opening arrows usually have plenty, the closing ones almost none, and the value runs the other way. It also shows where a chain forks or stalls. Generare runs into pharma, agro, animal health and cosmetics, and each branch prices differently. For EPICS, field efficacy is an intermediate result and not yet the terminal outcome.
Darwin did it without mathematics
Most people never try to build a model of this kind, and I think the reason is a category error. Models feel like something academics do, in journals, with equations, and if you cannot write the equation you assume the job is closed to you. Darwin did none of that. Things vary. Some variation is inherited. More organisms are born than survive. Those three sentences in plain English carry most of the diversity of life, and there is no equation anywhere in the book. They also committed him. In 1862, looking at a Madagascan orchid with its nectar at the bottom of a spur a foot deep, he said an insect must exist on that island with a tongue long enough to reach it. He had no insect. He had a flower. The moth was collected in 1903.6
Where a model comes from, and how it dies
Everything above is a filter. Description length lets you compare two models you already have, and an experiment lets you kill one. Neither of them writes a model, and no quantity of staring at the data will write one either. Tycho’s tables held no ellipse. Karl Popper built his account of science around what a theory refuses. A theory is worth having when it forbids things, so that the world has some way of contradicting it, and that property is falsifiability. Where the theory came from beforehand is not a question logic answers, and David Deutsch takes the missing step by putting creative conjecture at the beginning of knowledge.7 Somebody has to guess before anything can be tested.
A good explanation is hard to vary while it still does the same work. Winter comes because Persephone grieves underground, and you can swap the goddess, the emotion or the number of months and the story holds up exactly as well, which is the tell. Change any part of the axial tilt and it stops predicting the seasons.
That needs care, because plenty of what we model really is multi-causal, and naming several factors is not itself a dodge. What matters is whether the account tells you where to look.
Churn is up because the market got harder survives any substitution. Swap the market for pricing, onboarding or a competitor and it reads exactly as well, so it was never going to be wrong about anything.
Churn is up because we moved the onboarding call from day one to day seven, and the accounts leaving are the ones that never got it has its parts locked together. It says which accounts should be going, when it should have started, and what happens if we move the call back. Three other things may also be pushing churn. The claim is still checkable.
Break the question until it can be tested
Testing happens one arrow at a time, because a whole thesis is too large an object to put a result against. Development economics learned that the slow way. Does aid work? went round for decades because it was too big to answer, so whatever evidence turned up could be fitted into a view somebody already held. Esther Duflo, Abhijit Banerjee and Michael Kremer cut it into pieces small enough to run. Everybody in the field knew that handing out free bed nets was a mistake, since people do not look after what costs them nothing. Cohen and Dupas went to Kenya and charged sixty cents. Uptake fell by sixty percentage points, and the women who paid slept under their nets no more faithfully than the women who had been given them.8 The policy had run on that belief for years, and the belief had run on sounding sensible.
Angus Deaton and Nancy Cartwright point out the other half of this. An effect measured in one district says nothing by itself about whether it holds anywhere else.9 Every board has watched that happen without naming it. Somebody brings a pattern in from their last company and offers it as a rule, because it worked there. It did work there. It worked on a different buyer, at a different price, with tools that did not exist three years ago, against habits that have since moved. The result was real. The conditions it depended on were never written down, so what gets carried across is a number with its range stripped off. The mechanism is what tells you where a number stops applying, and without it you are transplanting a result and hoping.
What has to be true
Two earlier entries here, one on classification and one on classification at machine speed, warned against labelling anything complicated or moving. The sum tells you when to draw the line anyway. A label is a model. It costs you one more category to carry, and it earns back whatever you no longer have to spell out. Keep enterprise buyer if most of what follows about the account comes free once you have said it. Drop it when every use needs an exception bolted on, because the exceptions are the second term, telling you the category is not paying for itself.
The same test runs on a spreadsheet, which is why Aswath Damodaran’s Narrative and Numbers insists that narrative and numbers only work in pairs. The story supplies the causal model. The numbers stop it bending indefinitely. Nobody should believe a 2031 revenue line, and everybody should build one anyway, because getting to a figure forces the story to say what it implies.
None of it holds still, which the eye worked out long before we did. Roughly 120 million photoreceptors feed about a million fibres, so what reaches the brain was already a model, built to predict and corrected the moment the world disagrees.10 Hermann von Helmholtz called that unconscious inference in 1867, and Blaise Agüera y Arcas builds his account of intelligence on it. Organisms work the same way, compressing whatever stays regular around them, so that when the regularities move, fitness goes to whoever recompresses fastest. A company is in that position. So is the thesis you wrote about it, which is why I want probable paths and a note on which shifts make each one likelier.
So the memo has four questions to answer.
- Which arrows are weak?
- What should show up if each one is real?
- How long should that take?
- What is the clearest, fastest and cheapest evidence I can buy before more money goes in?
Then, quarter by quarter, when something refuses to fit, I can revise the chain or I can bolt on one more excuse. Sometimes the exception is real. But a thesis that survives by needing more independent things to be true is paying for its survival in complexity, and the fact that it still fits the record should give me less confidence than it did a year ago.
A good investment thesis is therefore not the one that predicts one future most confidently. It is the one that gives the smallest useful causal description of what has to be true, identifies the future paths that follow if it is, and leaves reality enough room to prove it wrong. That seems like a better standard for a memo, and, increasingly, for a decision.

Footnotes
-
[Context] Tycho Brahe’s pre-telescopic instruments resolved to roughly one or two arcminutes, so an eight-arcminute residue sat well above his measurement error. Kepler published the ellipse in Astronomia Nova (1609). ↩
-
[Source] Claude Shannon, “A Mathematical Theory of Communication”, Bell System Technical Journal, 1948. James Gleick’s The Information (2011) is the narrative way in. ↩
-
[Definition]
L(M)is what it costs to write the model down.L(D|M)is what it costs to write down the data once you already have the model, which makes it a measure of how much the model failed to anticipate. Predict well and there is little left to spell out, so the second term shrinks. Predict badly and every surprise has to be itemised. Formally it is the negative log-likelihood of the data under the model, so it really does measure predictive accuracy in bits. Jorma Rissanen, “Modeling by shortest data description”, Automatica 14(5), 1978. Peter Grünwald’s The Minimum Description Length Principle (2007) is the standard modern treatment. TheL(M) + L(D|M)expression used here is the intuitive two-part-code version, and modern MDL is richer than this shorthand. ↩ -
[Source] Ray Solomonoff, “A Formal Theory of Inductive Inference”, Information and Control 7, 1964. His full construction weights every candidate program by two to the minus its length and averages their predictions, which turns Occam into a rule for placing weight on what has not happened yet. ↩
-
[Source] Judea Pearl (UCLA) and Dana Mackenzie, The Book of Why (2018). Pearl’s ladder of causation distinguishes association, intervention and counterfactual reasoning. ↩
-
[Context] The orchid is Angraecum sesquipedale, its spur roughly 30 cm deep, discussed in Darwin’s Fertilisation of Orchids (1862). The hawkmoth was described in 1903 and named praedicta. Filmed feeding took another ninety years. ↩
-
[Source] David Deutsch (Oxford), The Beginning of Infinity (2011), particularly his account of creative conjecture and of good explanations as hard to vary. ↩
-
[Source] Jessica Cohen and Pascaline Dupas, “Free Distribution or Cost-Sharing?”, Quarterly Journal of Economics 125(1), 2010. Uptake fell sixty percentage points as the price moved from zero to $0.60, a subsidy cut from 100% to 90%. ↩
-
[Counter] Angus Deaton (Princeton) and Nancy Cartwright (Durham), “Understanding and misunderstanding randomized controlled trials”, Social Science and Medicine, 2018. Their target is the claim that randomisation alone settles what to do elsewhere. ↩
-
[Context] Counts vary by source and by individual, with photoreceptors usually put at 120 to 130 million and optic nerve fibres at 0.7 to 1.5 million. The order of magnitude is the point. Helmholtz set out unconscious inference in the Handbuch der physiologischen Optik (1867). ↩